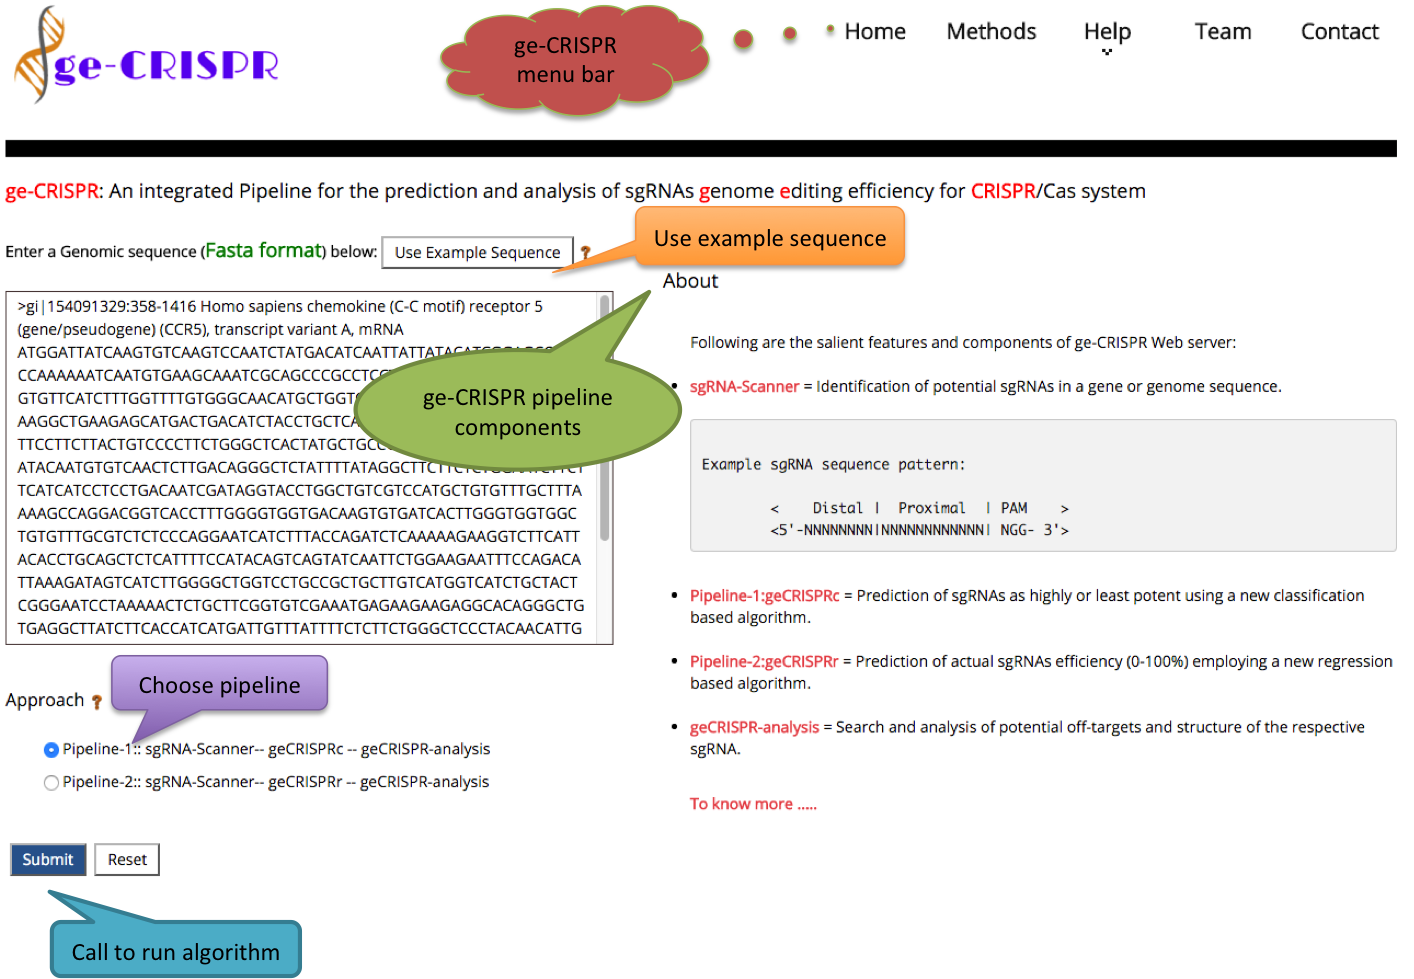
ge-CRISPR Input:
- Paste your single or multiple gene or genomic sequence(s) in FASTA format in the provided text-box.
- User can remove the entries from the text-box by using the reset button.
- An (Example sequence) has been provided to help the users. By clicking on Use Example sequence link Gene fasta sequence will be automatically filled in the text-box.
- Select Reference genome to find out off-targets associated with a particular sgRNA.
- User can click on the Submit button to run geCRISPR algorithm.
- Salient features and components of ge-CRISPR web server (Pipeline) is also shown on the home page for user guidance.
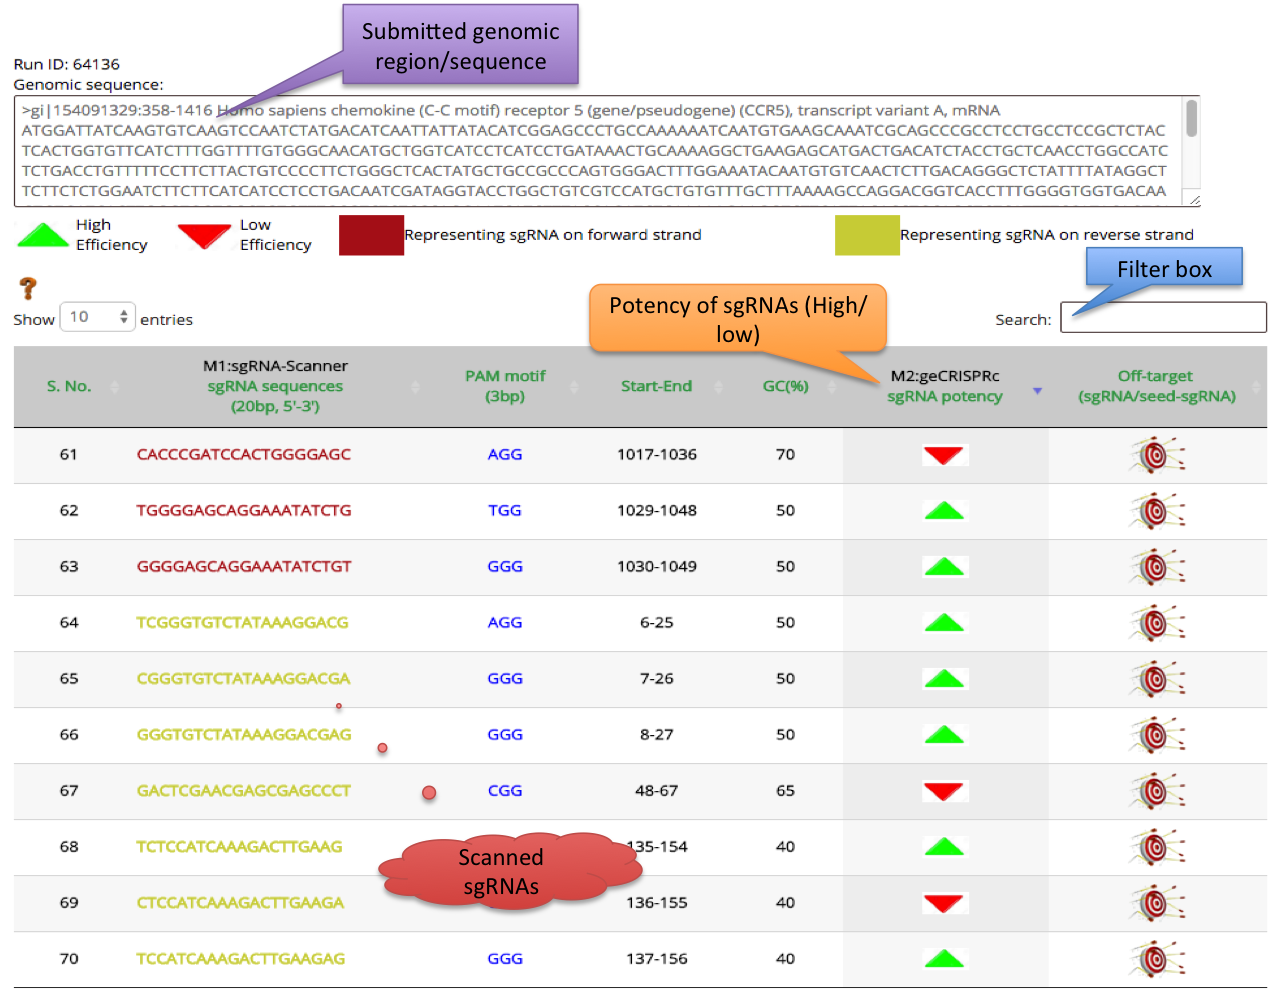
ge-CRISPR Results and Interpretation:
- For each Job submission a unique ID will be generated named as RUN ID.
- Results of the ge-CRISPR integrated pipeline will be shown in dual steps which is represented in a tabular as well as graphical format.
- To make this pipeline user-friendly, Out of 4 methods of ge-CRISPR, results of first 3 methods is shown in first step concluded in tabular format with further link to the execution of method 4 to analyse a respective sgRNA.
- Tabular representation contains 8 columns of output.
1) Result of first method sgRNA-Scanner is represented in 5 columns. First column is serial no. of sgRNAs, sgRNA sequences are shown in second column. In third, fourth and fifth columns PAM motif, Start-End coordinates and GC% is depicted respectively.
Target sgRNAs found on forward strand are represented in
Target sgRNAs found on reverse strand are represented in
2) Result of second method geCRISPRc algorithm is represented in 6th column. This algorithm predicts the sgRNAs Potency in term of high and low. This HIgh and low score is represented in the form of arrow (UP/DOWN). For Highly effective sgRNAs an UP side arrow
 in green color and for least effective sgRNAs a down arrow
  in red color is used.
3) Result of Third method geCRISPRr algorithm is displayed in 7th column. This algorithm predicts the sgRNAs genome editing efficiency score in Percentage (%). sgRNAs are sorted according to high to low efficiency percentage in tabular layout.
As illustrated below:
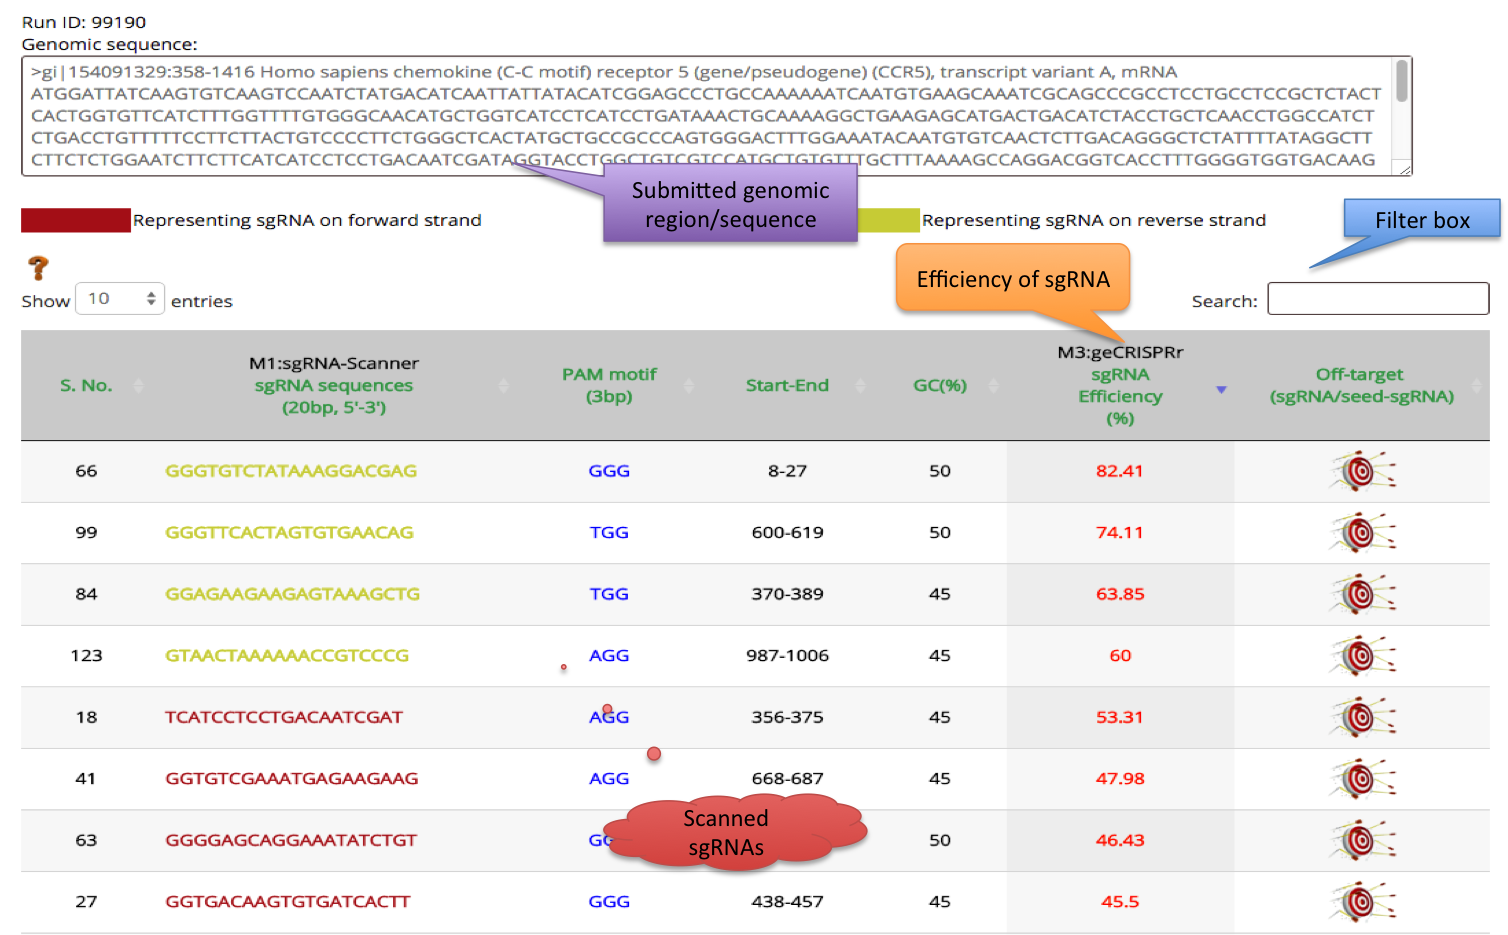
- In the last 8th column, geCRISPR-analysis : a link is provided to analyse particular sgRNA to screen off-targets in common model organism. This will be accomplished in two modes- First, using a complete sgRNA sequence with the cutoff of Query coverage should be 80% and Percent identity should be more than 90% on default e-value (10). Second, using a seed region of particular sgRNA (12 nt 5' proximal to the PAM motif) with the search parameter of 100% Query coverage and Percent identity as any mismatch in seed region affects its specificity and sensitivity and with the e-value of 100. Simultaneously, it also provide predicted secondary structure of sgRNAs.
- Output of off-target analysis for both the mode (Complete sgRNAs/seed sgRNA), is represented in two ways.
First is tabular output: Provide information of Query-ID, Subject-ID, Percent Identity, Alignment length, MIsmatches, Gap opens, Query start-end, subject start-end, e-value and score.
Second it provide detail output with mapped sequence of query sgRNAs and potential off-targets. As shown below:

Query  1         ATAAAGGACGAGGGG  15
                 |||||||||||||||
Sbjct  12116442  ATAAAGGACGAGGGG  12116428